
Best Horse Racing Betting Sites – Bet on Horse Racing in 2026
Loading...
Contents
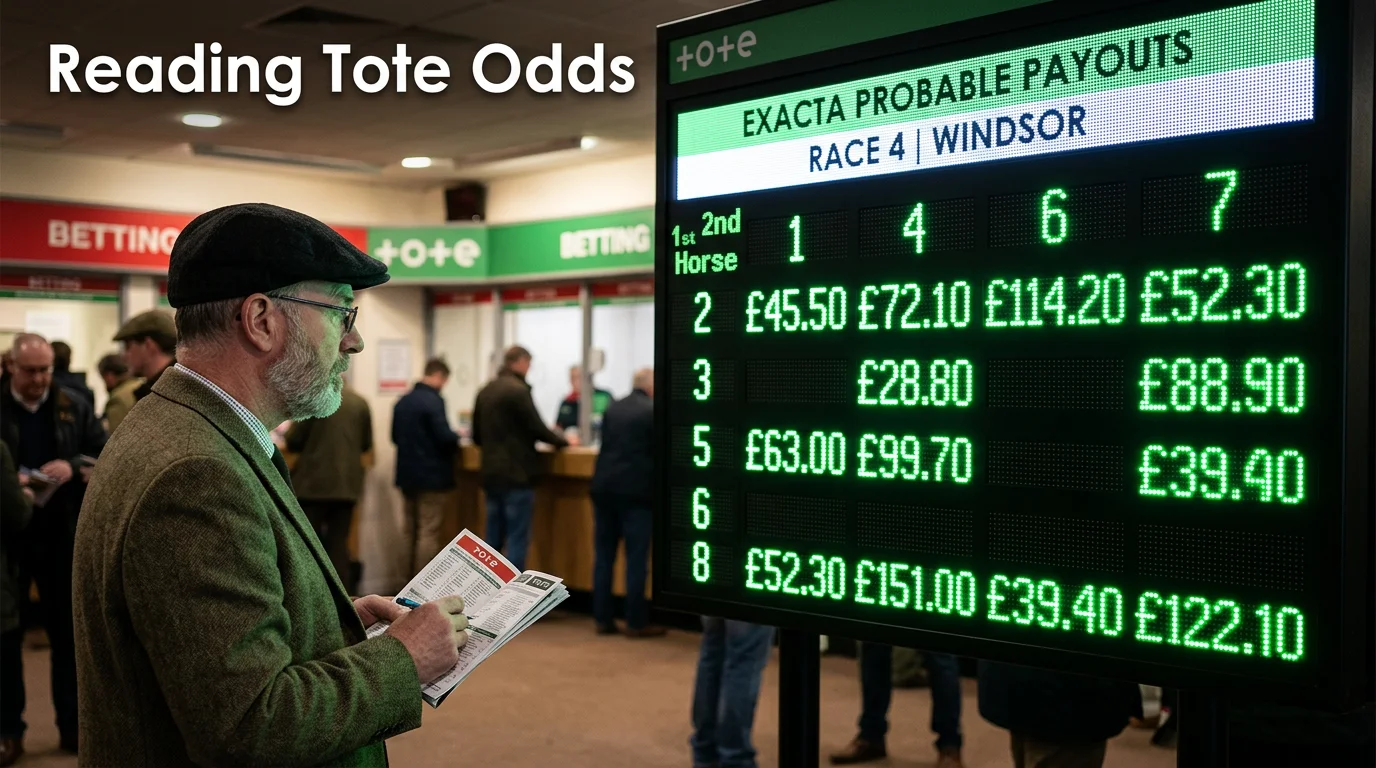
Understanding Tote odds for exacta betting separates informed punters from those who commit stakes without knowing what value they’re actually getting. The Tote displays probable payouts throughout the betting period, updating live as money enters the pool. Reading these figures correctly—and understanding their limitations—transforms exacta wagering from blind speculation into value-driven decision-making.
Pool betting works fundamentally differently from fixed-odds wagering. When you bet with a bookmaker, your price is locked at placement. When you bet the Tote, your dividend depends on final pool composition after the race. The indicative figures displayed pre-race guide your expectations but guarantee nothing. Learning to interpret these probables, compare them against likely outcomes, and identify genuine value opportunities is an essential exacta skill.
This guide explains how Tote odds displays work, what probable payouts actually indicate, and how to use this information strategically. Read the board, find the value.
UK racing exacta resources at exacta box bet.
Understanding Tote Odds Display
The UK Tote displays exacta odds as decimal figures representing returns to a £1 unit stake. A displayed probable of 45.00 indicates that if the combination wins, you would receive £45 for each £1 wagered. This decimal format mirrors how dividends are declared after races—the final exacta dividend is expressed the same way, as a return per £1 unit.
These displays update continuously as money enters the pool. In the final minutes before a race, updates arrive every few seconds, reflecting real-time betting activity. Earlier in the betting period, updates occur less frequently because pool activity is slower. The closer to post time, the more dynamic the display becomes.
Probable payouts account for the 25% pool deduction that the Tote applies before distributing winnings. When you see a probable of £50, that figure already incorporates the house take. The gross pool divided among winning tickets, minus the 25% deduction, produces the displayed probable. You’re seeing net returns, not gross returns.
The pool total displayed alongside probables indicates how much money has been wagered on that exacta pool. Thin pools produce volatile probables; deep pools produce stable figures. A pool showing £5,000 total will shift more dramatically with each new bet than a pool showing £500,000. Pool depth context helps you assess how reliable the displayed probables are likely to be.
Navigation through exacta probable matrices can seem complex initially. Platforms typically display a grid with potential first finishers on one axis and second finishers on the other. The intersection shows the probable for that combination. Some displays simplify this by letting you select horses and showing only the relevant combinations. Familiarity with your chosen platform’s interface prevents confusion during the time pressure of race betting.
Exacta Probable Payouts
Probable payouts are estimates, not guarantees. They show what the dividend would be if the pool closed at that instant with no further betting. Since substantial money typically arrives in final minutes, probables displayed thirty minutes out bear limited resemblance to final dividends. Even probables shown two minutes before post can shift if significant late bets arrive.
The mathematics behind probables involves dividing the pool (minus deduction) by the money wagered on each specific combination. If a pool totals £100,000 after deduction, and £500 has been bet on the 3-7 combination, the probable for that exacta equals £100,000 ÷ £500 = £200. This calculation updates dynamically as both total pool and combination-specific money change.
Favourite combinations naturally compress to lower probables because they attract heavier betting. If everyone fancies the same two horses to finish first and second, money concentrates on those combinations, dividing the pool among many winning tickets and producing modest returns. Overlooked combinations retain higher probables because fewer tickets share the pool if they win.
Performance data reinforces the value-seeking approach. A study by the UK Tote Group found that a £1 bet on every World Pool winner paid £171.44 more than the industry Starting Price. This aggregate outperformance demonstrates that pool betting consistently offers value compared to fixed-odds alternatives, rewarding punters who understand how to read and exploit pool dynamics.
Grid reading reveals market consensus and opportunities simultaneously. When scanning the exacta matrix, note which combinations attract compressed probables (the market’s fancied outcomes) and which retain elevated figures (overlooked or contrarian plays). Your analysis then determines whether the overlooked combinations represent genuine value—horses the market underrates—or justifiable neglect.
Comparing with Final Dividend
Final dividends often differ from final displayed probables, sometimes substantially. Understanding why helps calibrate expectations and prevents disappointment when returns miss anticipated levels.
Late money concentration creates the most common variance. If significant stake enters on your combination in the final seconds, your dividend compresses from the probable you observed. You might have seen £80 probable a minute before post, placed your bet, then collected £55 because late money piled onto the same combination. The opposite happens too—late money on other combinations leaves yours less diluted than indicated.
Dead heats introduce another variance source. When two horses can’t be separated for first or second place, the exacta pool distributes across more winning combinations than a clean finish would involve. Your dividend is calculated differently under dead heat rules, often producing returns below what any pre-race probable indicated for a straightforward result.
Non-runner deductions complicate late-stage readings. If a horse in the exacta field withdraws after you’ve placed your bet, stakes involving that horse are voided and returned. The remaining pool recalculates around fewer horses, changing all probables. Final dividends reflect this adjusted pool, which may differ from any probable you observed before the withdrawal.
Calculating realistic expectations involves accepting a variance band around displayed probables. On a stable pool with deep liquidity, final dividends typically fall within 10-15% of final probables. On thin or volatile pools, that band widens considerably. Treat probables as directional guides—this combination pays around this much—rather than precise predictions.
Using Odds to Inform Strategy
Strategic use of Tote odds display involves comparing displayed probables against your assessment of true probabilities. If you believe two horses have a 10% chance of finishing first and second in either order, your expected dividend needs to exceed ten times your stake to represent positive expected value. If the probable shows £25 on a two-horse box costing £2, you’re being offered 12.5:1 on a 10% shot—borderline value at best after accounting for variance.
See also: exacta novice races — high-variance betting on novice and maiden races.
Overlay hunting means seeking combinations where displayed probables exceed fair value. If your form analysis suggests a combination should pay around £40 based on the horses’ true chances, and the Tote displays £60 probable, you’ve identified a potential overlay. The market is underrating your selection, creating value. Conversely, combinations showing probables below fair value represent underlays—avoid them regardless of your confidence in the horses.
Pool depth affects strategy execution. In deep pools, your assessment of fair value can be pursued confidently because your own bet won’t distort the market. In thin pools, placing significant stake compresses your own probable, requiring adjustment. Consider betting smaller amounts more frequently rather than one large bet that moves the market against itself.
Comparative analysis across meetings sharpens value recognition. Track how probables at major fixtures compare to smaller meetings. Festival racing with its deep pools often produces tighter probables as market efficiency increases. Midweek racing with casual money sometimes leaves genuine overlays unaddressed. Building familiarity with typical dividend ranges for different scenarios helps identify unusual opportunities quickly.
Integration with traditional form analysis produces the best results. Tote odds displays tell you what the market thinks. Your form study tells you what you think. Where these diverge—where your analysis suggests different probabilities than market prices imply—potential value exists. The odds display isn’t the source of your selections; it’s the mechanism for validating that your selections offer worthwhile returns.